SenseOn Data Connectors
Add-on: Data Connectors are available if you have purchased a SenseOn for Cloud Add-on. Please speak to your customer success manager for access.
Data Connectors enable SenseOn XDR
SenseOn XDR correlates endpoint, network and user data collected through the Universal Sensor with activity and alerts from across your enterprise technology stack.
Our Data Connectors facilitate the ingestion of telemetry and alerts from your enterprise technology in order to:
- Simplify your security operations by consolidating threat detection and response across multiple data sources (endpoints, network, identity providers, cloud SaaS platforms etc.)
- Protect against threats which would otherwise be difficult to detect with siloed tools
- SenseOn's AI Triangulation correlates an attacker's actions into attack paths, managed and responded to easily through Cases
Available Connectors
If the integration sends log sources through a cloud feed, and we support its connector natively, you can configure the connection to the other platform using SenseOn's Data Connectors
There are three types of data connectors:
Telemetry Connector
- Ingests real-time activity data (e.g. user actions, system changes) generated by connected external platforms
- Our security experts build custom detections using telemetry, providing you with a wider coverage of threat types and techniques than you'd otherwise get with the default security alerts from the external platform/service
- Detections generated using telemetry form observations, which can be added to cases if correlated by SenseOn's AI Triangulation
Alert Connector
- Ingests security events that are automatically generated by the external platform being connected to
- Security alerts form observations, which can be added to cases if correlated by SenseOn's AI Triangulation
Response Connector
- Allows SenseOn to take action on the external platform on your behalf during case response (for example, revoking an identity provider session or disabling an account)
- Used during Active Response and Reflex flows where the action target lives outside the SenseOn-managed endpoint estate
- All response actions are audited. See Audit Log for the events recorded
| Data Connector | Type | Description | HuntLab Table |
|---|---|---|---|
| M365 Security Alerts | Alert | These are security alerts automatically generated from services that are either part of or integrated with Microsoft 365 Defender. They return rich, valuable clues about a completed or ongoing attack and the impacted assets. Microsoft Reference |
cloud_ms_graph_alert |
| Entra ID User Sign-in Logs (formerly Azure Active Directory Sign In logs) | Telemetry | These logs provide information about when and how users access their Microsoft Entra account (formerly Azure) services. Microsoft Reference |
cloud_ms_sign_in_log |
| Entra ID Audit Logs (formerly Azure Active Directory Audit logs) | Telemetry | These logs contain information corresponding to changes to applications, groups, users, and licences. Microsoft Reference |
cloud_ms_directory_audit_log |
| Office 365 Management Activity | Telemetry | The Office 365 Management Activity API provides information about various user, admin, system, and policy actions and events from Office 365. Microsoft Reference |
cloud_ms_o365_activity_log |
| Google Workspace Alerts | Alert | These are security alerts automatically generated for a Google Workspace domain. Google Reference |
cloud_google_workspace_alert |
| GCP Security Command Center Alerts | Alert | These are security findings (alerts) automatically generated for a GCP environment through the Security Command Center. They surface detected threats such as compromised identities (meshing with IAM), data exfiltration, and misconfigurations. Google Reference |
cloud_gcp_security_finding |
| AWS Security Hub Alerts | Alert | These are security findings (alerts) automatically generated for an AWS environment. AWS Reference |
cloud_aws_securityhub_alert |
EDR Connectors
Centralise alerts from third-party endpoint detection and response tools and, where supported, trigger device isolation through SenseOn. Isolation needs Active Response access.
| Data Connector | Type | Description |
|---|---|---|
| CrowdStrike EDR | Telemetry | Centralises and correlates alerts from CrowdStrike Falcon. Supports device isolation initiated from SenseOn. |
| SentinelOne EDR | Telemetry | Ingests SentinelOne EDR alerts and supports device isolation from within a SenseOn case. |
| Microsoft Defender for Endpoint | Telemetry | Centralises Defender for Endpoint alerts and supports device isolation. |
| Sophos EDR | Telemetry | Centralises alerts from Sophos Intercept X and related EDR products. |
| ESET EDR | Telemetry | Centralises ESET EDR alerts within SenseOn. |
Identity Response Connectors
Search identities and take containment actions (session revocation, account disablement) on third-party identity providers as part of a case response. Containment actions need Active Response access.
| Data Connector | Type | Description |
|---|---|---|
| Entra ID User Containment | Response | View user details, revoke sessions, and disable accounts via Entra ID. |
| Entra ID Identity Search | Response | Search Entra ID users from within a case, with response actions available. |
| Okta Identity Search | Response | Search Okta users, revoke active sessions, and disable accounts. |
| Google Workspace Identity Search | Response | Search Google Workspace users with session revocation and account disablement actions. |
| PingIdentity Search | Response | Search PingIdentity users with response actions available. |
Additional Connectors
The connectors below are also available in the integration catalogue. Some are in preview: confirm availability for your environment with your customer success manager before relying on them in production.
| Category | Connectors |
|---|---|
| Cloud | Cisco Umbrella, Cato Networks, Microsoft Defender for Cloud |
| SaaS Security | Abnormal AI, Mimecast |
| Asset Management | Cisco Meraki, Nozomi Networks, ServiceNow CMDB |
| SIEM | FortiAnalyzer, Rapid7 InsightIDR |
| Ticketing & Collaboration | Slack, Microsoft Teams, Jira, ServiceNow |
| Vulnerability Management | CrowdStrike Falcon Spotlight, Qualys, Rapid7 InsightVM, Tanium, Tenable, Orca Security |
Setting Up and Managing Data Connectors
1. Accessing the Integrations page
- Select Integrations in the main side menu
- The page lists everything you have installed in a single table: data connectors, personal integrations and any custom log sources (see Log Ingestion). The table has five columns:
| Column | Description |
|---|---|
| Source | The connected service, with its icon. A connection set up by an individual user shows Personal integration for and the owner's name |
| Type | Connector, Personal integration or Custom log. Select the Type column heading to open a filter menu with a checkbox and count for each type present, and Clear filter to reset it |
| Category | The connection's catalogue category (Cloud, Identity, SaaS and so on), or a dash where the catalogue has none. Custom log sources leave this column empty |
| Status | The current state of the connection (see Viewing connection details below) |
| Latest data received | When data last arrived from the connection |
- Use the search box above the table to narrow it, and the Type column filter to show only connectors, personal integrations or custom logs
- If you have nothing installed yet, the page opens straight on the set-up page described below
2. Setting up a new Connector
- Select Set up a new integration to open the set-up page (Integrations › Available). Select Installed integrations at any time to return to your installed list
- The set-up page shows the catalogue of available connectors beneath a search box. Use the search box, the category filter badges (you can select more than one at once) or the Installed / Not installed badges to find the service you want; connectors that are not yet available show Get notified when we launch instead
- Each card shows an Installed (or Installed ×N) badge where you already have a connection of that type, which links to your installed list filtered to it, and a Personal integration badge where relevant
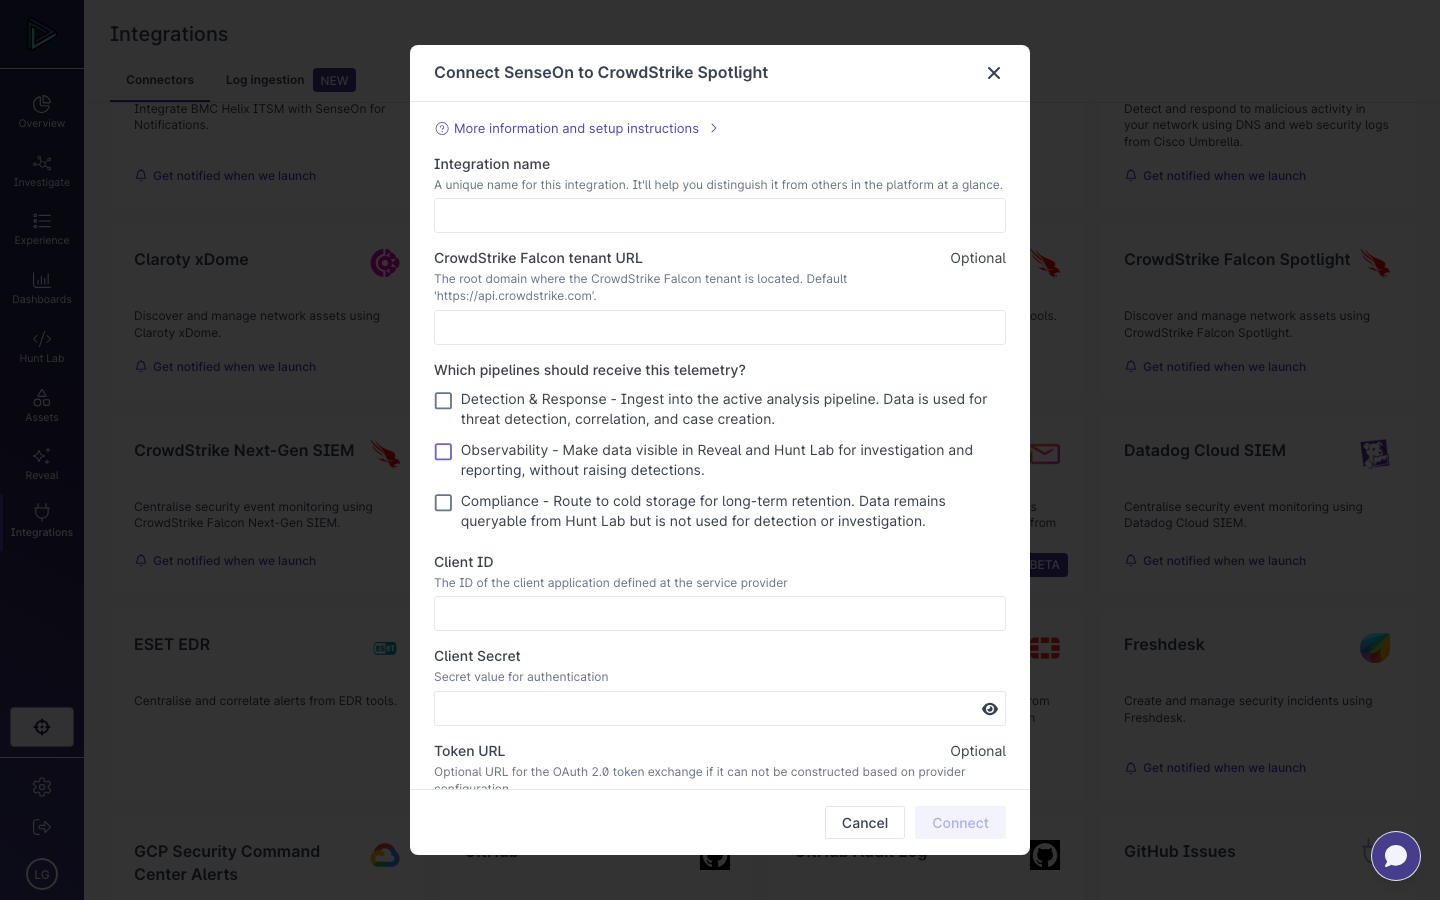
- Select the connector's card to open the connection form
- Complete the form for the chosen connector:
- Integration name — a unique name to distinguish this connection from others in the platform
- Authorisation credentials and provider-specific fields, for example a tenant URL, client ID, and client secret
- Which pipelines should receive this telemetry? — choose one or more of:
- Detection & Response — ingest into the active analysis pipeline; data is used for threat detection, correlation, and case creation
- Observability — make data visible in Reveal and Hunt Lab for investigation and reporting, without raising detections
- Compliance — route to cold storage for long-term retention; data remains queryable from Hunt Lab but is not used for detection or investigation
- Select Connect
3. Viewing connection details
- Select a connected row in the table (click it or press Enter) to open a modal with specific information about the connection. A row for a connection that is still pending set-up opens its set-up instead
| Connector Details | Description |
|---|---|
| Status | Current state of the integration:
|
| Connection created | Timestamp when the connector was last activated or created |
| Data last received | Timestamp when the external service last sent data to the connector |
| Data last fetched | Timestamp when the data connector last attempted to ingest data |
| Connection status last checked | Timestamp of the last health check |
| Organization ID | ID of the associated organisation in GCP |
| Applied filter | The filter applied to specify which alerts to ingest from the M365 security alerts connector |
| Tenant | Microsoft Tenant from which the connector fetches data |
4. Managing existing connections
The list is ordered A to Z by Source by default. The Source and Latest data received headings each carry a sort menu:
- Source — A to Z or Z to A
- Latest data received — Newest first or Oldest first
Sources that have not yet received any data stay at the bottom of the list whichever way you sort. The sort order is not saved, so the list reopens A to Z by Source each time.
To narrow a long list, use the Search your integrations box, or open the Type column heading's filter to show only chosen types. While a search or type filter is active, a Showing X of Y integrations summary appears beneath the list (shown as "Showing 1 of 1 integration" when a single integration matches), alongside a Clear filter control that resets the search and type filter in one step.
The column headings, including the Type filter and the sort menus, stay pinned beneath the page header as you scroll.
5. Modifying a connection
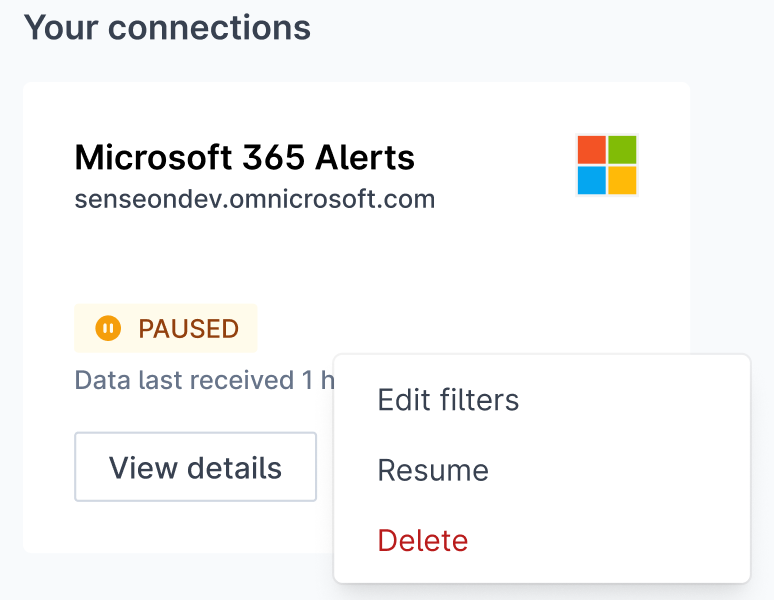
- Open the actions menu (the three-dot
...menu) on a connection's row - Options may include:
- Edit filters: Adjust the scope of data being collected
- Resume/Pause: Toggle the active state of the connection
- Delete: Remove the connection entirely
6. Microsoft 365 Security Alerts & Google Workspace Alerts specific information
- With these connectors you can optionally provide a filter which specifies which alerts to be ingested by SenseOn
- Visit this Microsoft doc or Google doc to learn more
7. AWS Security Hub Alerts specific information
- The AWS Security Hub Alerts connector authenticates using an IAM role, not access keys. During setup you provide a Role ARN and an External ID:
- Role ARN — the Amazon Resource Name of a role in your AWS account that grants SenseOn read access to Security Hub findings
- External ID — the value that scopes the trust relationship so that only the SenseOn integration role can assume your role
- Create the role so that it trusts the SenseOn integration role and is constrained by the External ID shown in the setup form. Follow the in-product setup instructions for the exact trust policy and permissions to attach.
AWS Security Hub must be enabled. This connector reads findings from AWS Security Hub (the non-CSPM service — see our provider's AWS Cloud Security setup guide for the exact prerequisite). If AWS Security Hub is not enabled in the connected AWS account and region, every query fails with an
AccessDeniedExceptionnaming a Security Hub action your role already holds, which reads as a permissions problem rather than a missing service. Enable AWS Security Hub before setting up the connector.
Remember that each connector may have unique setup requirements or features. Always refer to the specific instructions provided during the setup process for any connector-specific steps or considerations.
Troubleshooting
Each connector is monitored for health periodically to identify when a connection is potentially failing.
When a connection becomes unhealthy or has not been configured correctly, the connection status will be set to Error and details of the error will be provided:
| Connector(s) | Error Message | Cause | Troubleshooting |
|---|---|---|---|
| AWS Security Hub Alerts GCP Security Command Centre Alerts |
Subscription is missing | The integration was not activated and is therefore missing a subscription | Complete the steps required to activate the integration. |
| AWS Security Hub Alerts GCP Security Command Centre Alerts |
Subscription heartbeat is missing | The integration is expecting heartbeats but none have arrived yet | This is most likely due to the subscription being just set up and the heartbeat did not arrive yet - waiting for a bit should give the integration enough time to send heartbeats. If it doesn’t help, see below: |
| AWS Security Hub Alerts GCP Security Command Centre Alerts |
Last heartbeat is too old | At least two consecutive heartbeats got lost | There is most likely something wrong with the AWS or GCP infrastructure. Check the deployed AWS infrastructure for errors (Lambda, event bridge.). Check that the notification config was created in GSCC and that all the setup commands ran successfully. |
| Microsoft 365 Security Alerts 0365 Management Activity |
Unable to read API Endpoint | The integration tries to download a single alert just to check that it can reach the endpoint and fails | Double check the provided tenant ID and make sure the integration was authorised. |
| Microsoft 365 Security Alerts<br /0365 Management Activity | Subscription validation failed | Subscription details are invalid (or corrupted) and do not match Microsoft’s source of truth. | Try deactivating (deleting) the subscription and creating it again. |
| Google Workspace Alerts Entra ID Sign-in Logs Entra ID Audit Logs |
Unable to read API endpoint | The integration has tried to ingest a single alert to validate the connection setup but has failed | Double check the provided tenant ID and make sure the integration was authorised. |
| AWS Security Hub Alerts | AccessDeniedException naming a Security Hub action your role already holds | AWS Security Hub (the non-CSPM service) is not enabled in the connected AWS account and region. The role has the right permissions, but there is nothing to grant access to. | Enable AWS Security Hub in that AWS account and region, then retry. |
The table above covers connections that have moved into the Error state. A connection can also sit in Connected and still deliver nothing, which does not raise an error. The next section covers that case.
Connected, but no data has arrived
If a connection shows as Connected but Data last received is empty, or has not moved for some time, work through the checks below before contacting support. Open View details on the connection first. Read Data last fetched against Data last received, as the pair tells you where to look.
| Data last fetched | Data last received | What this points to | What to do |
|---|---|---|---|
| Recent | Never, or old | SenseOn is polling the service successfully, but the service is returning nothing. The cause is almost always on the source side, or the filter. | Work through the source-side checks below. |
| Never, or old | Never, or old | Fetching has stalled or has never run. This is not something you can resolve from the source side, and the periodic health check will not always have moved the connection into Error. | Note the connection name and both timestamps, then contact support@senseon.io. |
| Recent | Recent | The connection is working. Data is arriving. | If you cannot find the data, confirm you are querying the right Hunt Lab table for the connector, using the table above. |
Source-side checks
- Allow for the initial delay. After a successful connection it can take up to 5 minutes before ingestion begins.
- Confirm the source has generated qualifying events. An empty Data last received is the expected and correct state when the external service has produced nothing to send. If Microsoft has raised no security alerts in the period, there is nothing for the connector to ingest. Check in the source console that events exist for the window you are looking at.
- Check the applied filter. For the M365 Security Alerts and Google Workspace Alerts connectors, a filter that is narrower than intended will silently exclude everything. The active filter is shown as Applied filter in the connection details. Remove or widen it to test.
- Confirm the connection is not paused. A paused connection reports Paused rather than Connected, but it is worth confirming you are reading the status of the connection you think you are.
- Confirm you are looking at the right connection. There is no limit on the number of instances of a connector, so several may be listed for the same service. Use the Tenant and Organization ID fields in the connection details to identify which instance covers the tenant you are investigating.
- Confirm the authorisation still stands, against the right tenant. Credentials and consent can be revoked or can expire on the source side, and a connection authorised against the wrong tenant will connect successfully and return nothing. Check that the consent granted in the source service is still in place and names the expected tenant.
- Confirm the source is licensed to produce the data. Some services only expose alerts or audit data on certain licence tiers or with the relevant auditing enabled. If the data is not being generated or exposed by the service, the connector cannot retrieve it.
Confirming ingestion directly
The connection details are a summary and not a substitute for looking at the data. To confirm whether anything has landed, query the connector's Hunt Lab table from the table in Available Connectors above. For example, for the M365 Security Alerts connector:
SELECT * FROM cloud_ms_graph_alert ORDER BY _time_observed DESC LIMIT 10
An empty result with a recent Data last fetched points back to the source-side checks. Rows arriving means ingestion is working, whatever the summary fields suggest.
If you still need help
Contact support@senseon.io with the connector name, which tenant it covers, the Data last fetched and Data last received values, the window in which you expected data, and confirmation that the source console shows events in that window. That is enough for the SOC to tell the two directions apart without a round trip.